Scripts and workflows for the assembly, polishing, quality assessment, and visualization of complete cyanobacterial genomes.
This repository contains step-by-step protocols and scripts for generating high-quality cyanobacterial genome assemblies from sequencing data. The workflow covers hybrid assembly, contig circularization, quality evaluation, and multiple visualization approaches commonly used in comparative and structural genomics.
Each chapter corresponds to one logical step in the genome assembly and evaluation pipeline. Chapters are designed to be followed sequentially, but individual steps can also be used independently.
The Merqury QV output file has five columns:
<label> <err_kmers> <total_kmers> <QV> <error_rate>
Column descriptions
| Column | Meaning |
|---|---|
| label | Assembly name (or combined assemblies) |
| err_kmers | Number of assembly k-mers not found in the reads |
| total_kmers | Total number of assembly k-mers |
| QV | Phred-scaled quality value |
| error_rate | Estimated base error rate |
<label>                         <err_kmers>   <total_kmers>   <QV>     <error_rate>
BacterialGenome_Bactopia        0             4536393        +inf    0
PlasmidGenome_Bactopia          0             4018           +inf    0
both                            0             4540411        +inf    0
Notes:
- A
+infQV indicates zero observed error k-mers relative to the reads. - An
error_rateof0reflects no estimated base errors under this metric.
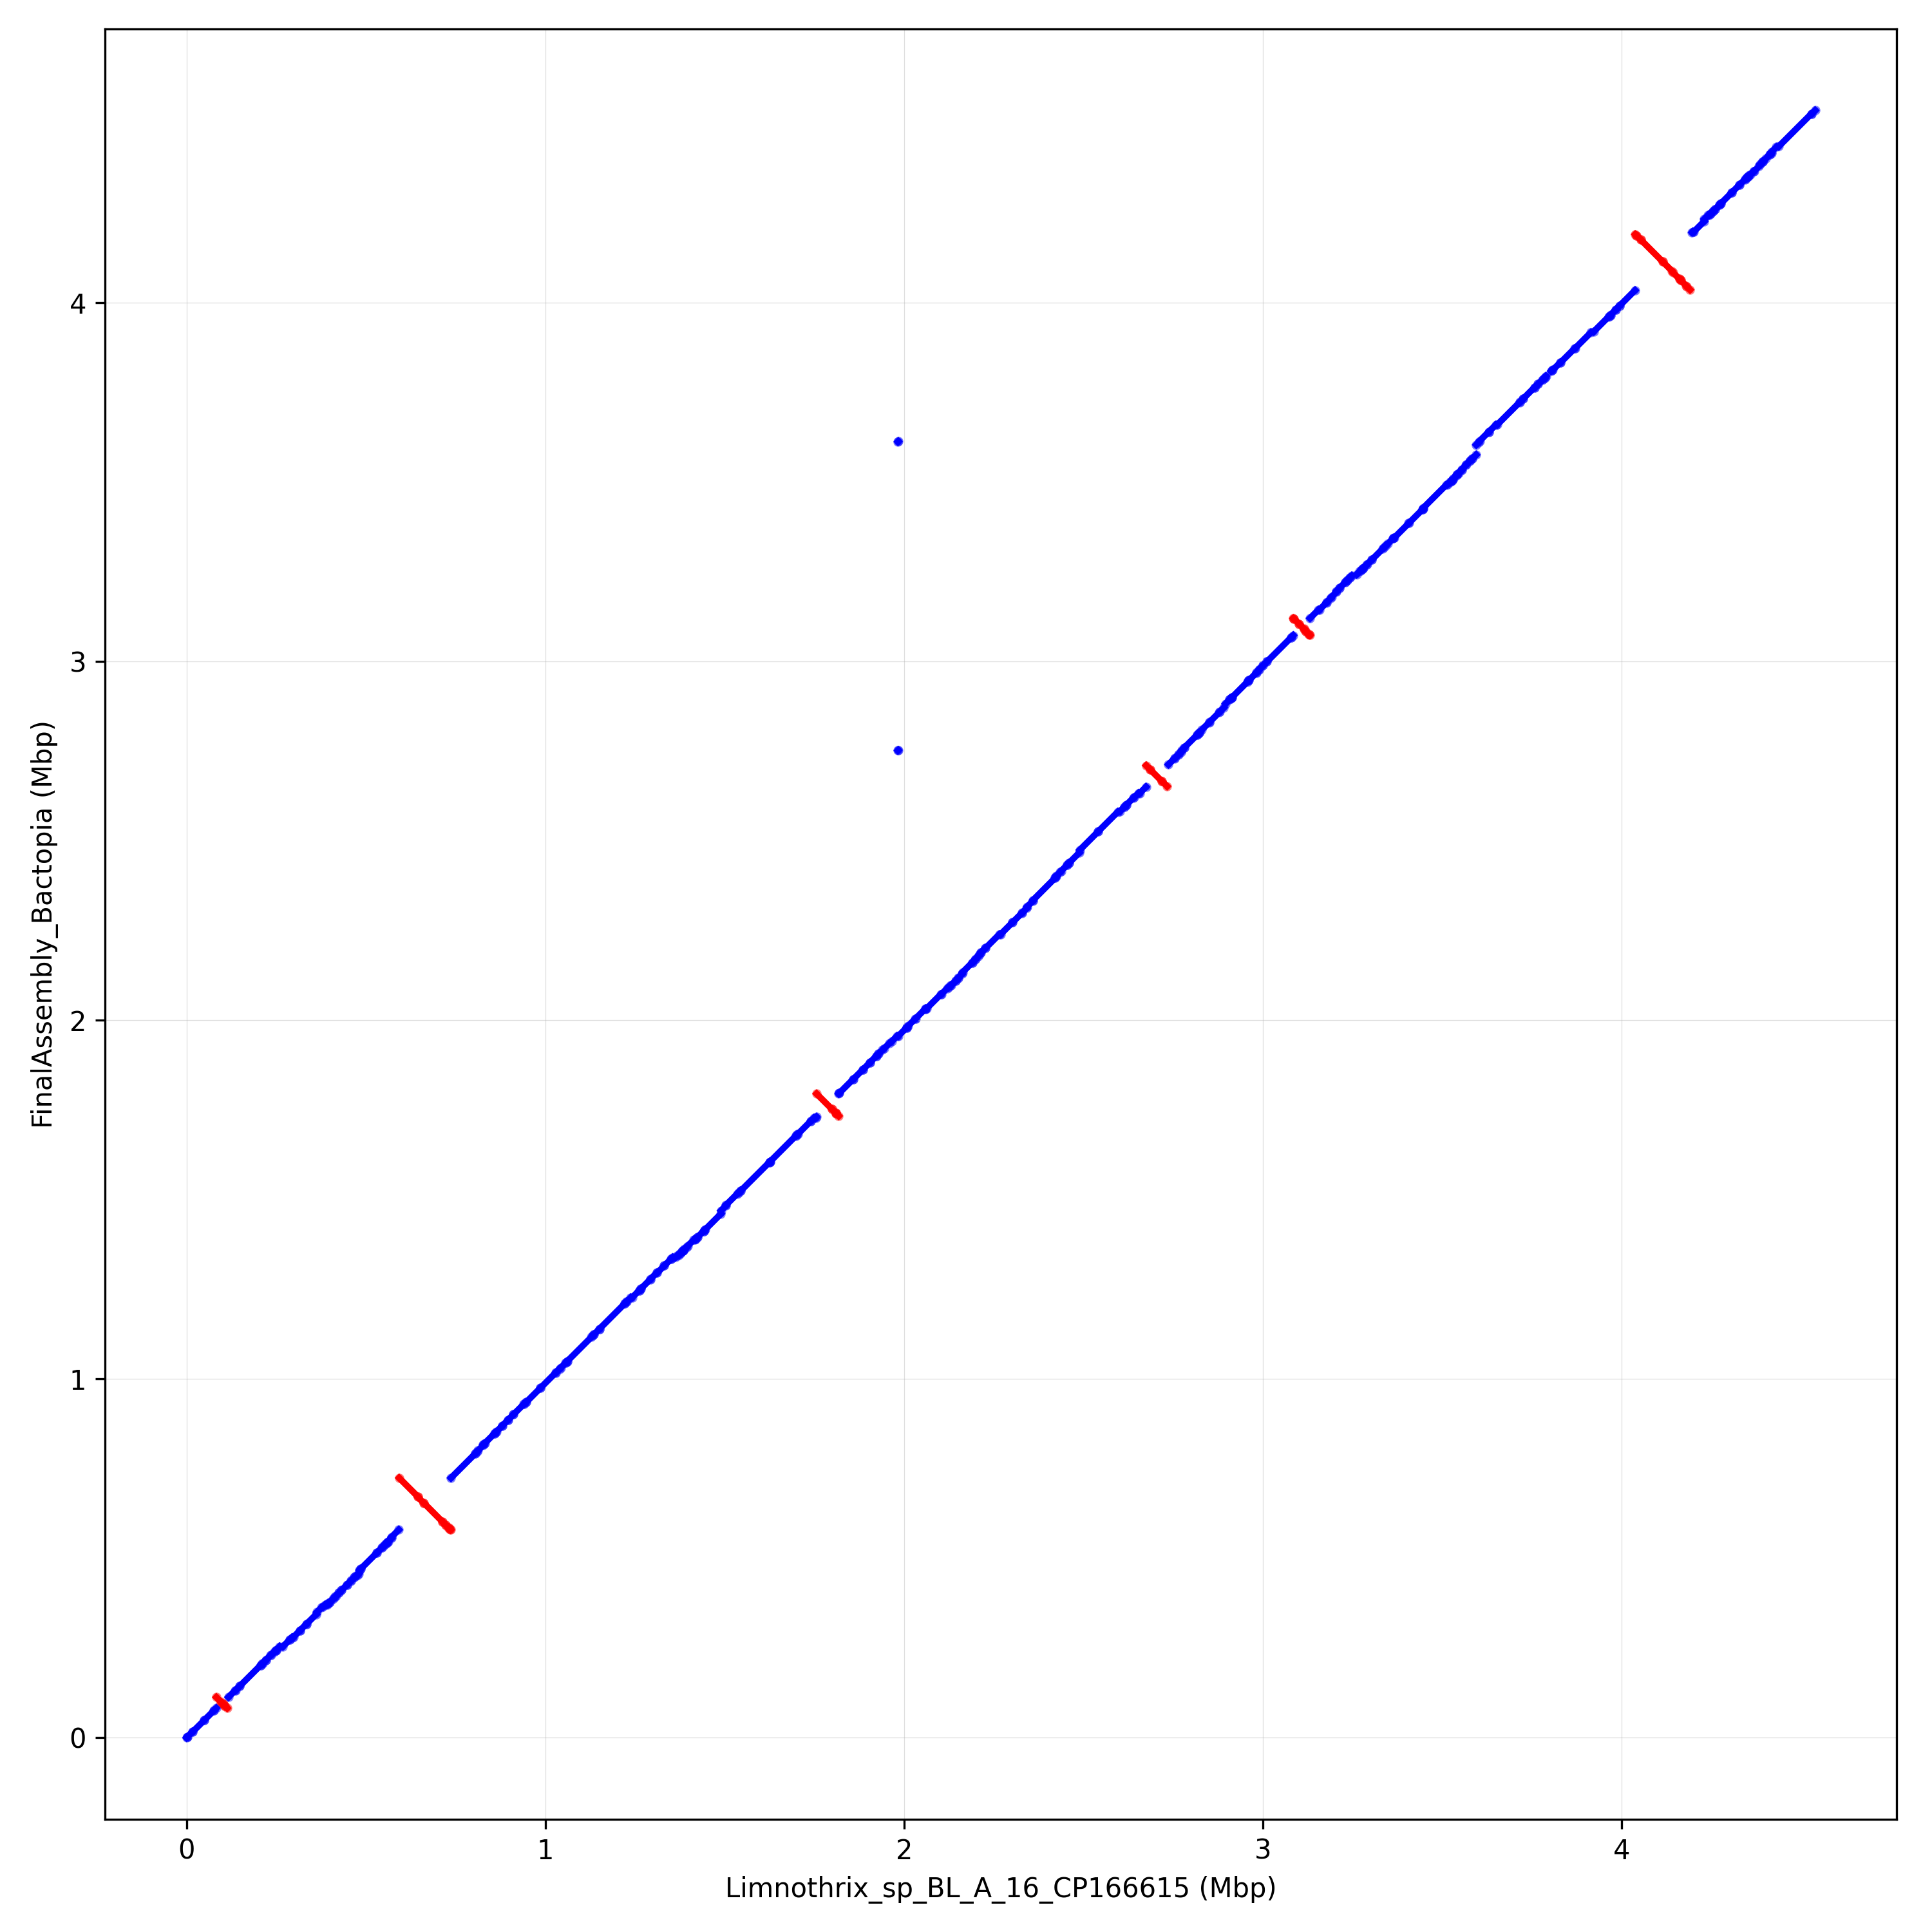
Limnothrix_sp_BL_A_16_CP166615	82994	113322	30329
Limnothrix_sp_BL_A_16_CP166615	592628	736045	143418
Limnothrix_sp_BL_A_16_CP166615	1756173	1817785	61613
Limnothrix_sp_BL_A_16_CP166615	2674925	2733309	58385
Limnothrix_sp_BL_A_16_CP166615	3085082	3131342	46261
Limnothrix_sp_BL_A_16_CP166615	4038055	4191007	152953
-
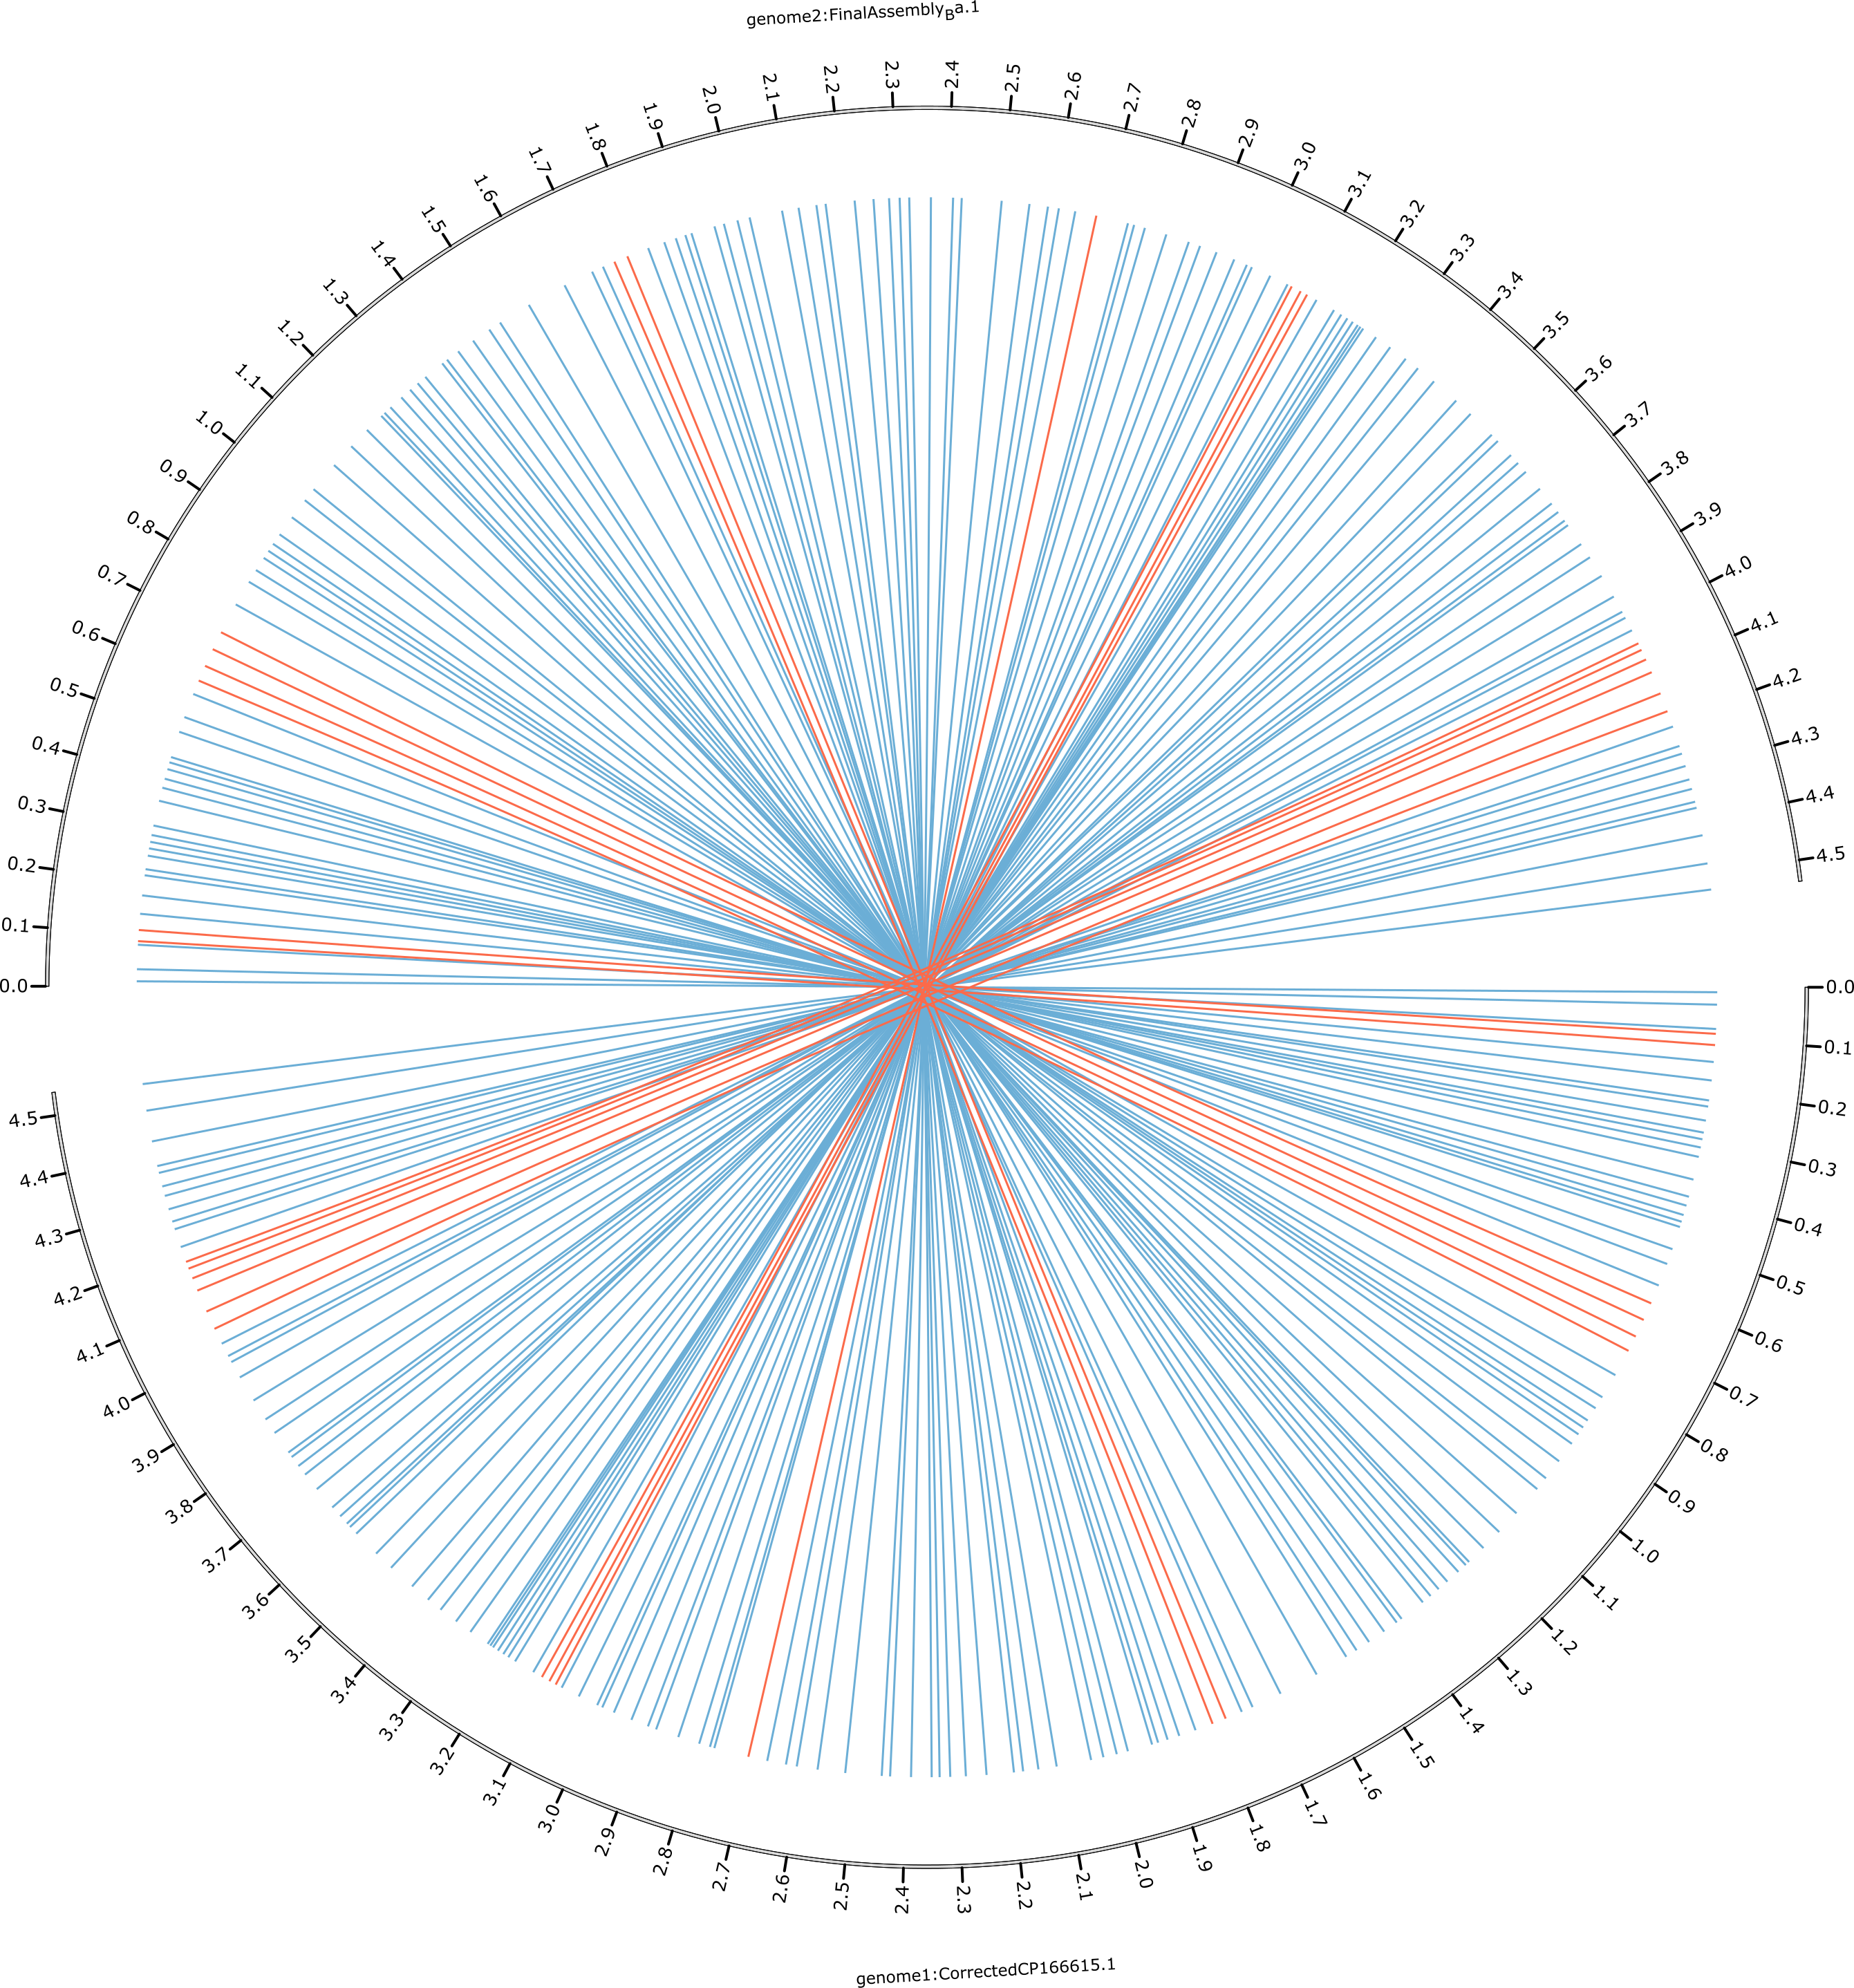
Show inversions within the assembly using Circos
-
Show synteny and collinearity between Limnothrix B-16 and the assembly using Circos
# Bacterial genome
python Step1__PYSCRIPT_Evaluate_reading_frames_of_genes.py -i Limnothrix_sp_HT2024_Bactopia.gb -o Limnothrix_sp_HT2024_Bactopia_ANNOTATION-INFO
# Bacterial plasmid
python Step1__PYSCRIPT_Evaluate_reading_frames_of_genes.py -i Limnothrix_sp_HT2024_plasmid.gb -o Limnothrix_sp_HT2024_plasmid_ANNOTATION-INFO# Bacterial genome
python Step2__PYSCRIPT_Compare_genes_by_name_and_position.py Limnothrix_sp_HT2024_Bactopia.gb Limnothrix_sp_HT2024_bacass.gb --max-start-diff 500- Standardize the annotations of a bacterial genome
This script ensures that every
CDSand everygeneannotation contain at least agene-tag as well as aproduct-tag. Thegene-tag contains the four-letter gene abbreviation. The full behaviour of the script is as follows:
# Bacterial genome
python Step3__PYSCRIPT_Standardize_annotations_of_bacterial_genome.py input.gb output.gb
grep -v '/gene="unknown_gene"' output.gb | grep -v "/locus_tag=" > output_final.gb
# Bacterial plasmid
python Step3__PYSCRIPT_Standardize_annotations_of_bacterial_genome.py Limnothrix_sp_HT2024_plasmid.gb Limnothrix_sp_HT2024_plasmid_TMP.gb
grep -v '/gene="unknown_gene"' Limnothrix_sp_HT2024_plasmid_TMP.gb | grep -v "/locus_tag=" > Limnothrix_sp_HT2024_plasmid_FINAL.gb| Situation | Action | Log style |
|---|---|---|
CDS already has valid gene and product |
Copy missing values to the paired gene feature; CDS remains authoritative |
White if nothing changes, yellow if synchronization changes something |
Only the gene feature has valid gene and product |
Copy missing values to the paired CDS feature |
Yellow if this changes the CDS, otherwise white |
gene and CDS disagree |
Prefer CDS values and record the conflict in the report | Yellow if resolved successfully, red if still unresolved |
Valid product exists but gene is missing |
Try local mapping first; otherwise query UniProt cyanobacteria by product to infer the most common gene abbreviation | Yellow on successful resolution, red on failure |
Valid gene exists but product is missing |
Try local mapping first; otherwise query UniProt cyanobacteria by gene to infer the most common product description | Yellow on successful resolution, red on failure |
standard_name is present |
Use it as supporting information during local resolution and as the displayed name in logs | Shown as standard_name instead of locus_tag |
standard_name is hypothetical protein CDS or hypothetical protein gene |
Do not query UniProt and do not log the annotation; still standardize /product to hypothetical protein |
No log output |
Product is already hypothetical protein for one of those hypothetical-standard-name annotations |
Leave it as hypothetical protein or rewrite it to the same standard form |
No log output |
| Nothing reliable can be inferred | Fall back to unresolved values such as unknown_gene or remaining missing information, and record it in the report |
Red |
| Annotation does not change | Keep existing values as they are | White |
| Priority | Rule |
|---|---|
| 1 | Prefer existing CDS qualifiers over gene qualifiers |
| 2 | Copy missing values across paired gene and CDS features |
| 3 | Apply the local mapping table |
| 4 | Query UniProt cyanobacteria by product if gene is missing |
| 5 | Query UniProt cyanobacteria by gene if product is missing |
| 6 | Skip logging and UniProt lookup for annotations whose standard_name is hypothetical protein CDS or hypothetical protein gene, but still standardize their product to hypothetical protein |
| 7 | Record conflicts and unresolved cases in the report |
- Run PAGP Foo bar baz
Foo bar baz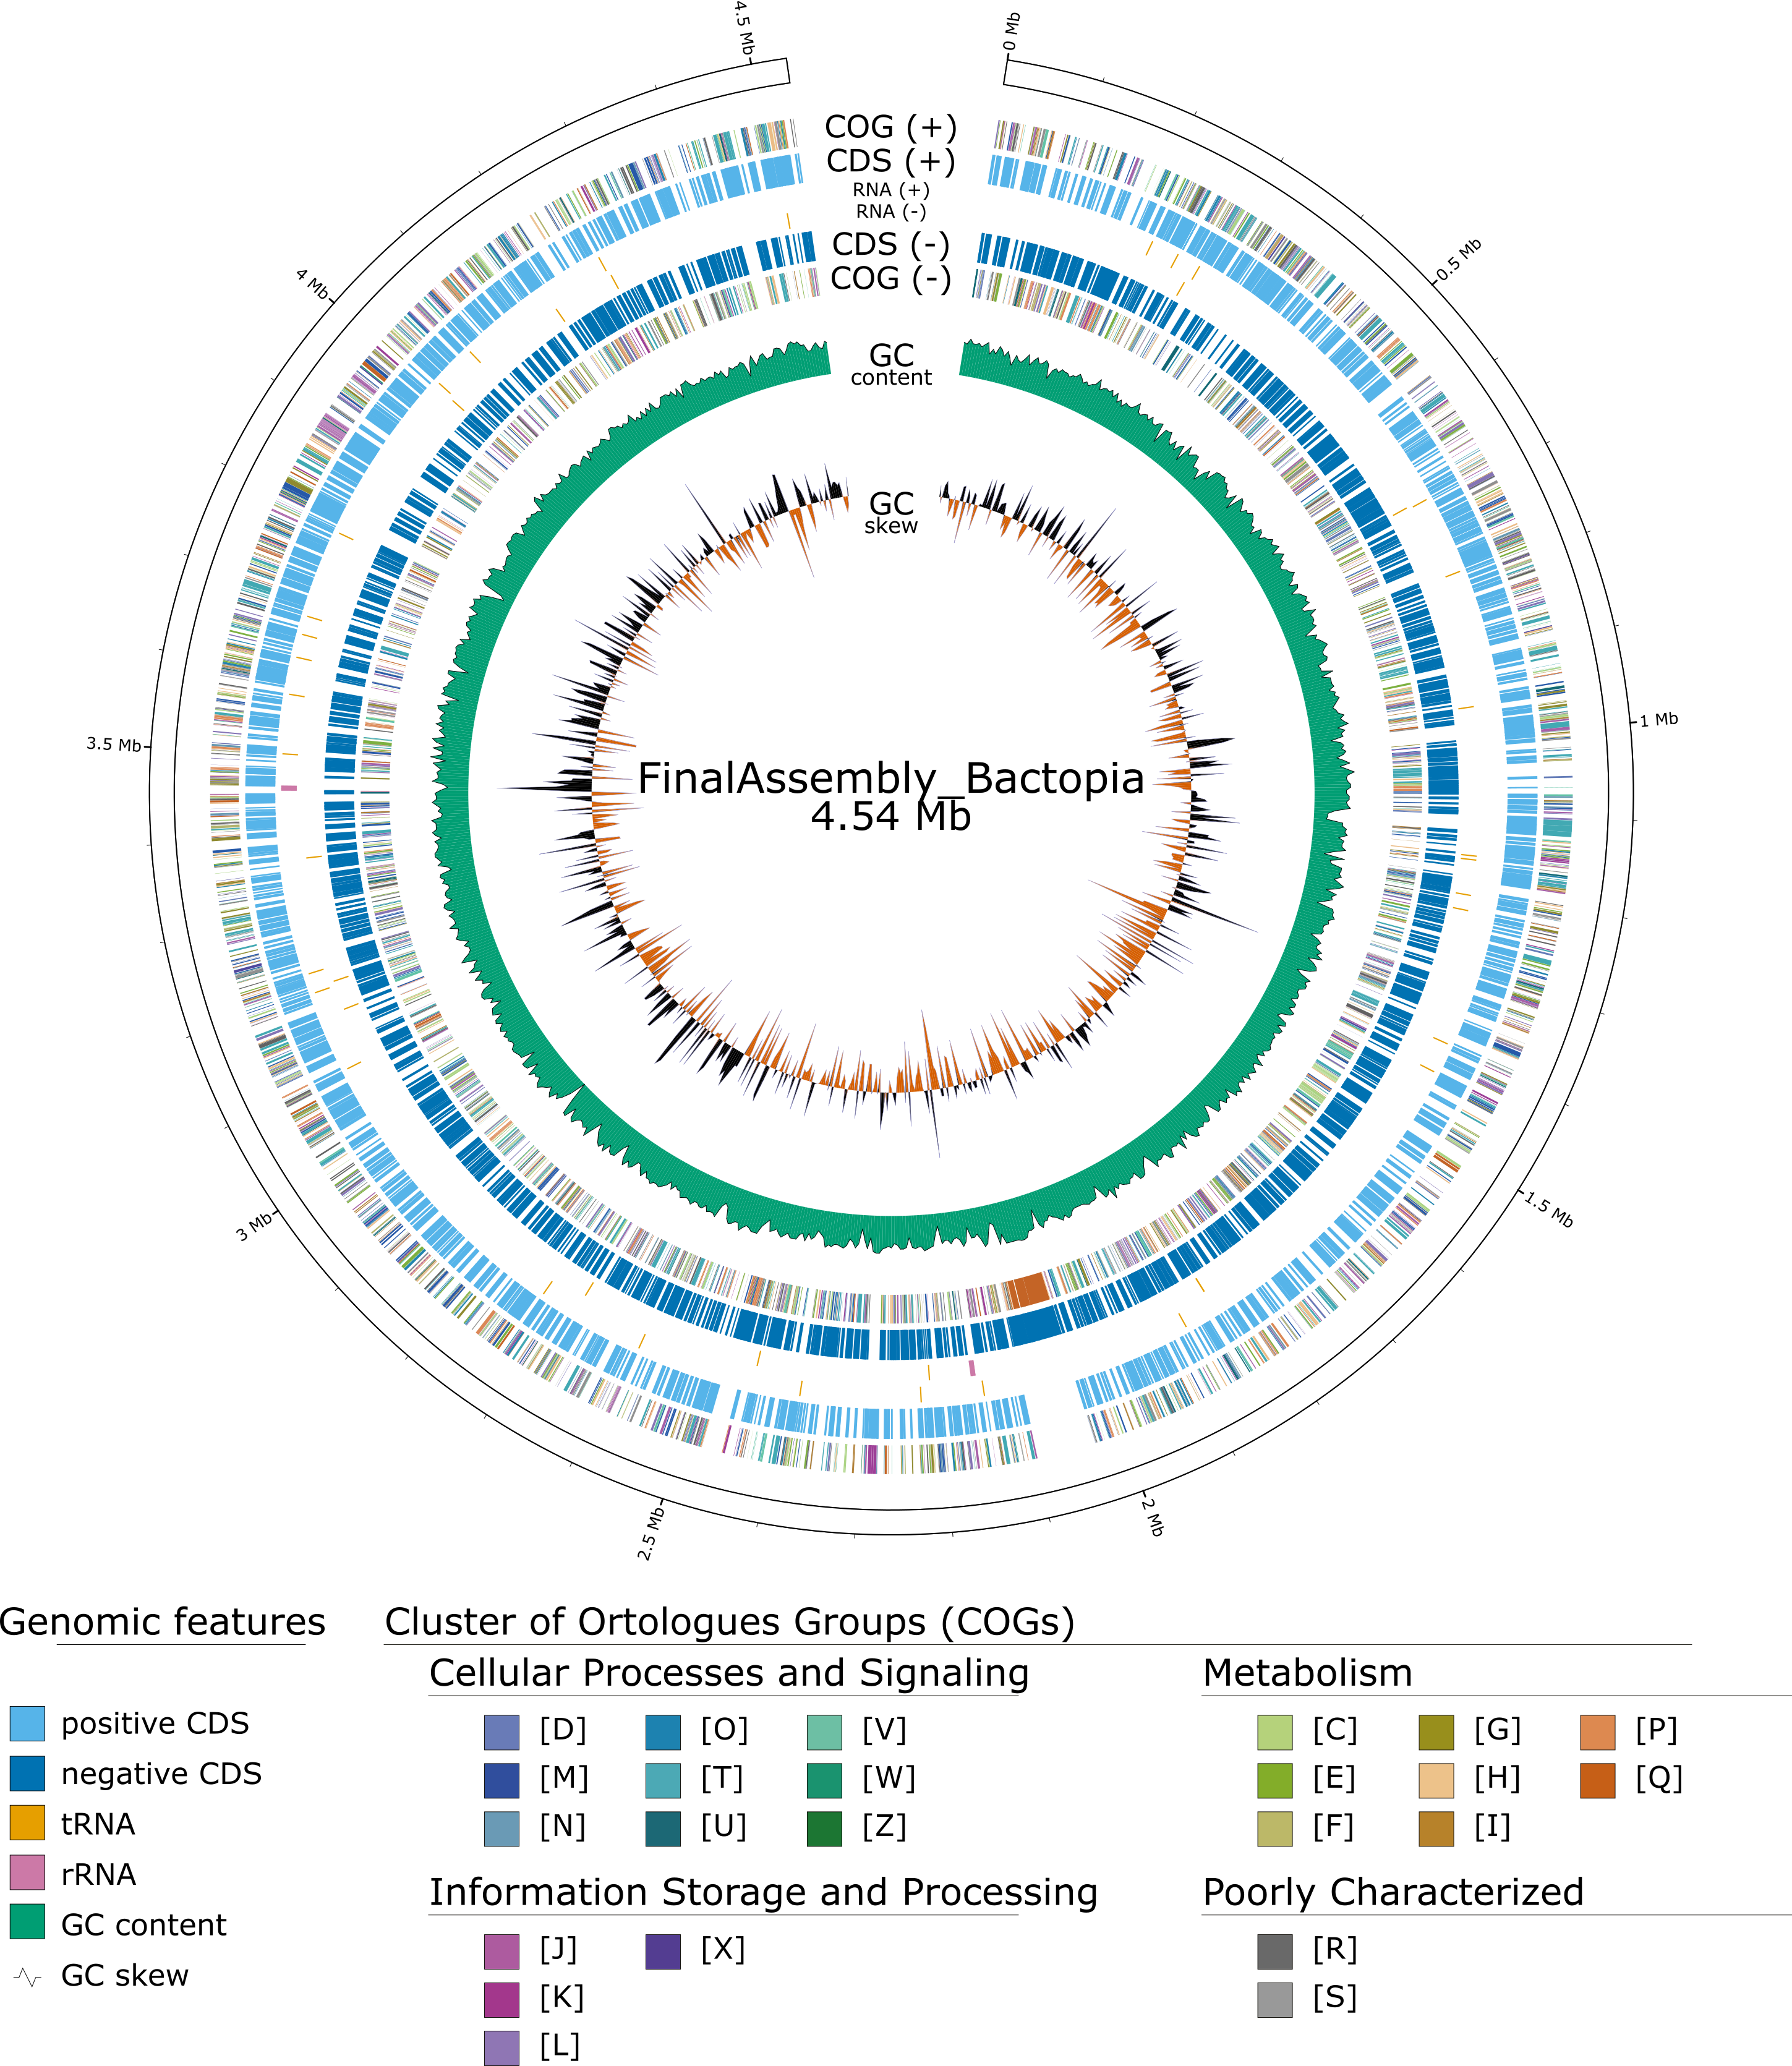
| Metric | HorseThief_lake_water_2 | HorseThief_in_cultivation |
|---|---|---|
| Raw reads | 54,376 | 91,377 |
| ASV method | DADA2 | DADA2 |
| Number of ASVs | 201 | 272 |
| Number of genera | 53 | 67 |
| Number of families | 40 | 46 |
| Shannon diversity | 6.570 | 6.341 |
| Pielou evenness | 0.859 | 0.784 |
| Simpson diversity | 0.983 | 0.972 |
- Image files are stored in the corresponding
data_STEPXX__*directories. - All workflows assume Linux environments and standard bioinformatics toolchains.
- Individual steps can be adapted to other bacterial genomes with minimal modification.