


See exactly how each document moves through your retrieval pipeline -- and measure whether re-ranking actually helps.
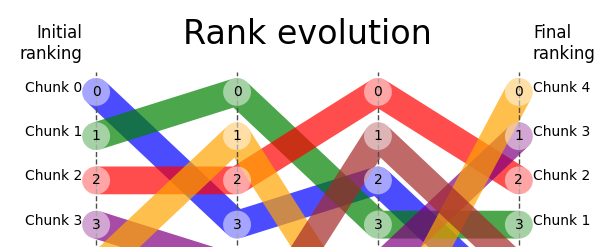
RankFlow visualizes and evaluates rank evolution across retrieval and re-ranking steps in RAG pipelines. Instead of staring at log files, you get a clear picture of what each pipeline stage does to your search results.
- Your re-ranker might be making things worse -- RankFlow shows per-step metrics (NDCG, MRR, Precision, Recall, MAP) so you know exactly which stage helps and which hurts.
- You can't optimize what you can't see -- rank evolution plots reveal how documents shuffle between stages, which ones get dropped, and where relevant results fall off.
- Evaluating one query isn't enough --
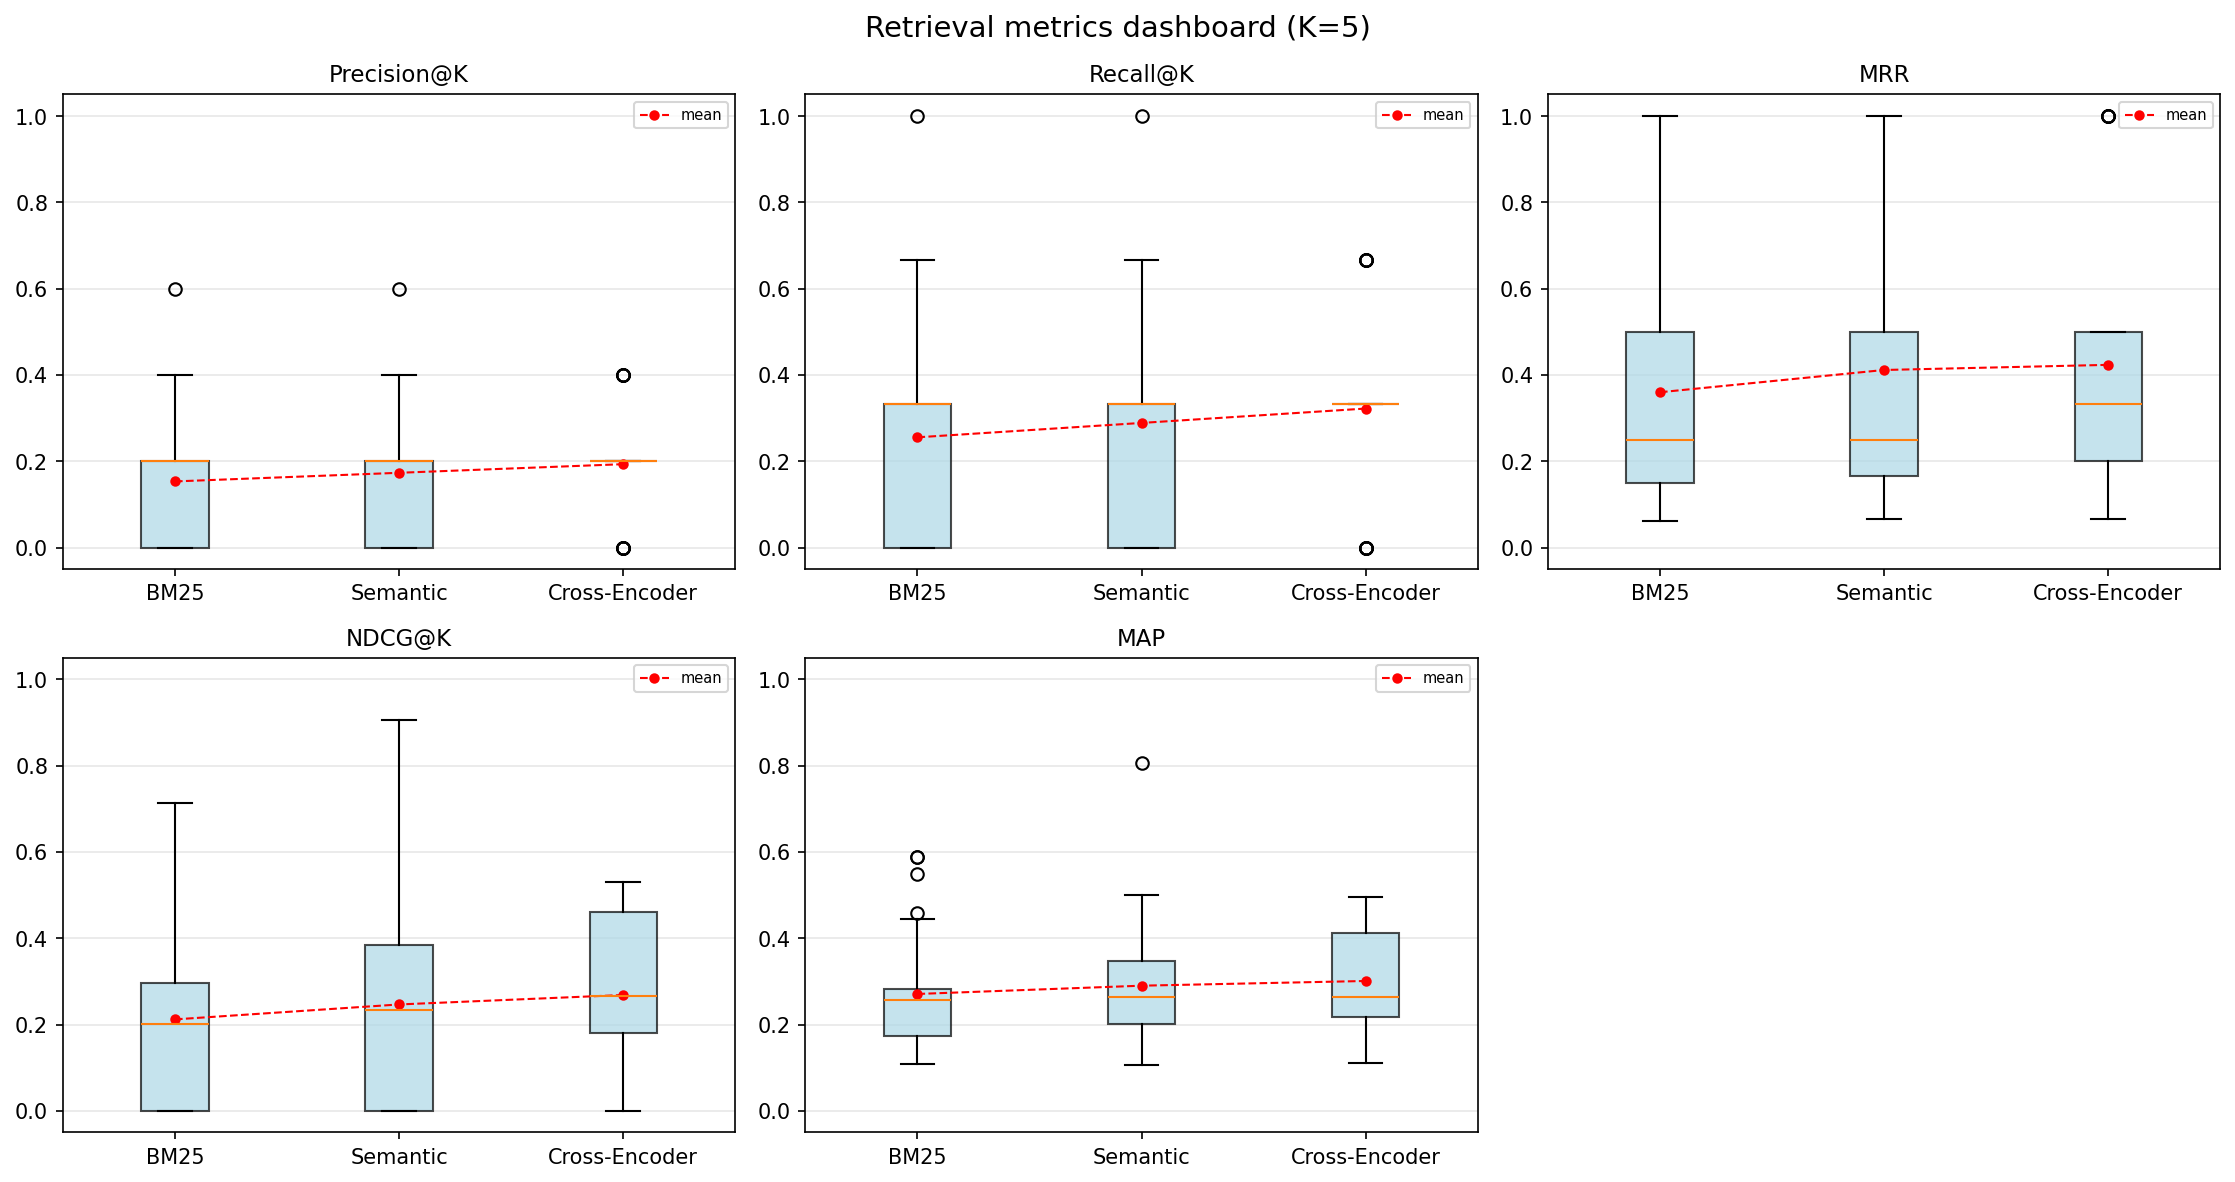
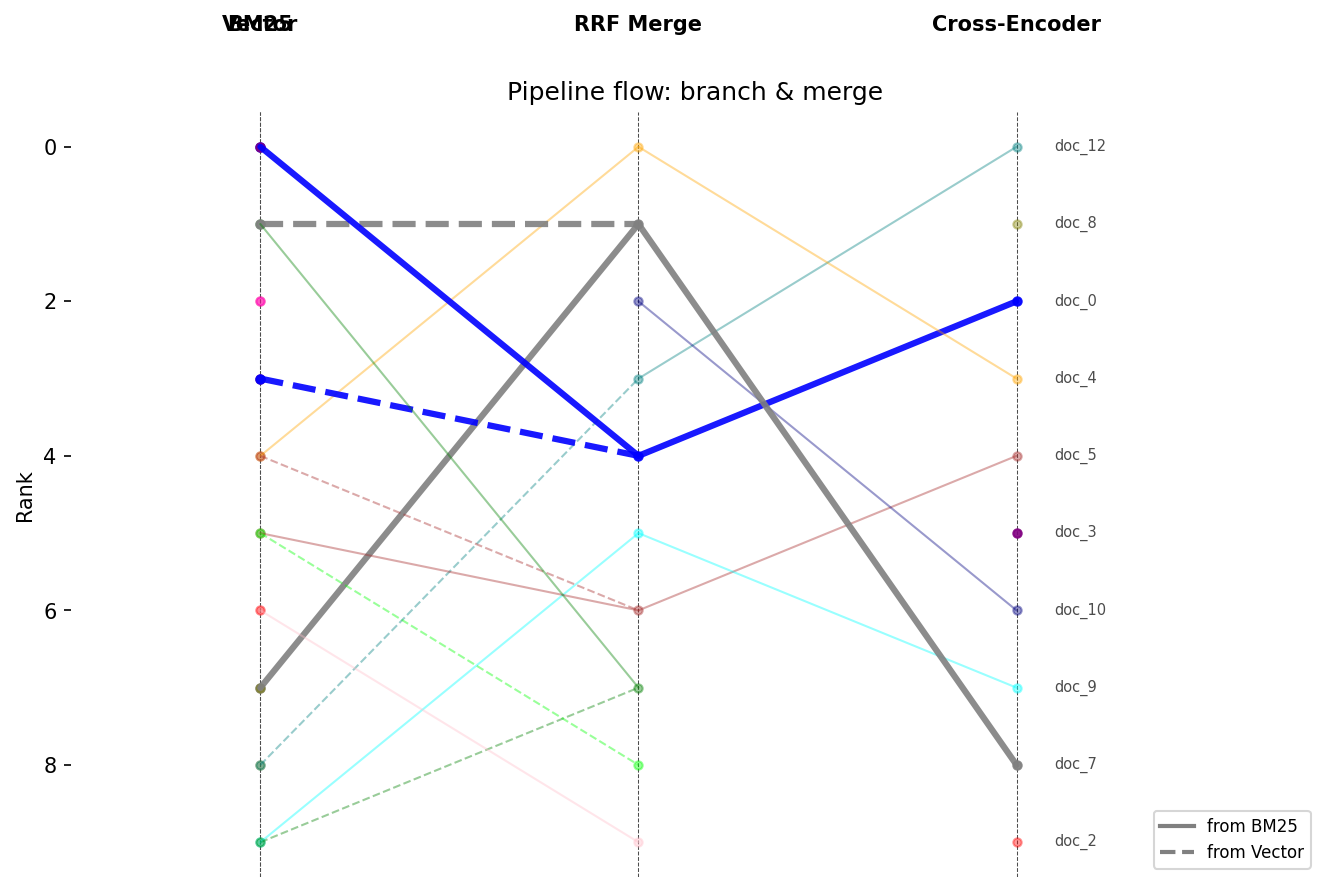
BatchRankFlowaggregates across hundreds of queries with dashboards, win/loss analysis, and automatic failure detection. - Hybrid search is a black box --
MergeRankFlowmodels branching pipelines (BM25 + vector search), showing overlap between branches and whether they're complementary or redundant. - Experiment tracking shouldn't require MLflow -- save, load, and statistically compare retrieval experiments with a file-based store. No database, no infra.
pip install rankflowimport numpy as np
from rankflow import RankFlow
rf = RankFlow(
ranks=np.array([[3, 0, 5, 1, 2], [1, 2, 4, 0, 3], [0, 3, 6, 1, 2]]),
step_labels=["BM25", "Semantic", "Cross-Encoder"],
chunk_labels=["doc_a", "doc_b", "doc_c", "doc_d", "doc_e"],
relevant_chunks=["doc_a", "doc_c"], # ground truth
show_metrics=True,
)
rf.plot()Relevant documents are highlighted, irrelevant ones fade out, and retrieval metrics are annotated at each step.
| Density mode (100+ docs) | Batch evaluation dashboard | Hybrid pipeline (MergeRankFlow) |
|---|---|---|
 |
 |
 |
| Feature | Description |
|---|---|
| Rank evolution plot | Line plot showing how each document's rank changes across pipeline stages |
| Density mode | Percentile bands for 100+ documents with focus lines for top-K and relevant docs |
| Interactive Plotly | Hover tooltips with document name, rank, score, and delta |
| A/B comparison | Side-by-side rendering of two pipelines |
| Source provenance | Distinct markers/colors for text vs. vector vs. hybrid results |
| NaN handling | Dashed lines for documents that appear or disappear between steps |
| Feature | Description |
|---|---|
| Per-step metrics | Precision@K, Recall@K, MRR, NDCG@K, MAP computed at every pipeline stage |
| Graded relevance | Numeric relevance grades with colormap visualization |
| Rank deltas | Annotate rank changes between consecutive steps |
| Per-chunk summary | Initial/final rank, max gain, max loss, total displacement |
| Top-K filtering | Focus on top-K documents (modes: any, initial, final) |
| Feature | Description |
|---|---|
| Aggregated metrics | Mean/std across all queries per step |
| Metrics dashboard | Box plots for all metrics in a single figure |
| Win/loss/tie analysis | Count queries that improved or degraded at each transition |
| Difficulty segmentation | Group queries by difficulty, compare metric evolution per bucket |
| Improvement heatmap | Queries x transitions matrix colored by metric delta |
| Failure detection | Automatically find queries where the pipeline made results worse |
| Feature | Description |
|---|---|
| DAG pipeline model | MergeRankFlow for branching/merging pipelines (BM25 + vector + RRF) |
| Overlap analysis | Shared vs. exclusive documents at merge points |
| Rank correlation | Spearman rho between branches -- are they complementary or redundant? |
| Branch visualization | Distinct line styles per source branch with legend |
| Feature | Description |
|---|---|
| Experiment registry | ExperimentStore saves/loads experiments as JSON files -- no database needed |
| Pipeline config | Attach pipeline_config dicts to RankFlow, preserved through export/import |
| Experiment comparison | compare_experiments() with config diff, per-metric deltas, paired t-test p-values |
| Win/loss/tie | Count queries that improved, degraded, or stayed the same |
| Regression detection | Identify specific queries where the challenger is worse |
| Web UI | Interactive Streamlit dashboard for browsing and comparing experiments |
| Format | Import | Export |
|---|---|---|
| TREC run/qrels | RankFlow.from_trec_run() |
rf.to_trec_run() |
| RankFlow JSON | RankFlow.from_rankflow_json() |
rf.to_rankflow_json() |
| ranx | RankFlow.from_ranx() |
rf.to_ranx_run() |
| RAGAS | RankFlow.from_ragas() |
-- |
| pandas | RankFlow(df=df) |
rf.to_dataframe() |
| dict / JSON | -- | rf.to_dict() / rf.to_json() |
rf = RankFlow(
    ranks=ranks,
    step_labels=["BM25", "Semantic", "Cross-Encoder"],
    chunk_labels=chunk_labels,
    relevant_chunks=["doc_a", "doc_c"],
    relevance_grades={"doc_a": 3, "doc_c": 1},
)

for step, m in zip(rf.step_labels, rf.metrics(k=5)):
print(f"{step}: NDCG@5={m['ndcg_at_k']:.3f} MRR={m['mrr']:.3f}")from rankflow import BatchRankFlow
batch = BatchRankFlow(rankflows) # list of RankFlow objects
batch.plot_dashboard(k=10) # box plots for all metrics
# Find queries where re-ranking hurt performance
for f in batch.failure_cases(metric="ndcg_at_k", k=10, threshold=-0.1):
print(f"{f['query_label']}: {f['initial_value']:.3f} -> {f['final_value']:.3f}")rf = RankFlow(
ranks=ranks_150_docs,
step_labels=step_labels,
chunk_labels=chunk_labels,
relevant_chunks=relevant,
density_focus_k=10,
)
rf.plot(mode="density")from rankflow import Experiment, ExperimentStore, compare_experiments
store = ExperimentStore("./experiments")
baseline = store.load("bm25-baseline")
challenger = store.load("cross-encoder-v1")
report = compare_experiments(baseline, challenger, k=10)
print(f"Win/Loss/Tie: {report.wins}W / {report.losses}L / {report.ties}T")
for metric, data in report.metric_deltas.items():
sig = "*" if data["p_value"] < 0.05 else ""
print(f" {metric}: {data['delta']:+.3f} (p={data['p_value']:.3f}) {sig}")rf = RankFlow.from_trec_run(
["bm25.run", "reranker.run"],
qrels_path="qrels.txt",
query_id="q1",
)
rf.plot()Step-by-step notebooks in notebooks/:
- Quick Start -- creating plots from arrays and DataFrames, customizing appearance
- Metrics & Analysis -- relevance highlighting, IR metrics, rank deltas, top-K filtering
- Advanced Visualization -- A/B comparison, density plots, source provenance, Plotly
- Batch Evaluation -- multi-query aggregation, dashboards, win/loss, failure detection
- Adapters & Export -- TREC/RAGAS/ranx import, JSON export, hybrid pipeline modeling
- Experiments & Comparison -- experiment registry, statistical comparison, regression detection
- Web UI Walkthrough -- synthetic data generation, launching the Streamlit dashboard, page-by-page guide
pip install rankflow              # core (matplotlib + numpy)
pip install rankflow[pandas]      # + pandas support
pip install rankflow[interactive] # + Plotly interactive plots
pip install rankflow[all]         # everything
For adapter and UI dependencies (optional):
pip install rankflow[ranx]        # ranx IR evaluation library
pip install rankflow[ragas]       # RAGAS RAG evaluation framework
pip install rankflow[ui] # Streamlit web UILaunch the interactive experiment explorer:
rankflow ui ./experimentsThe UI provides four views: experiment list, comparison dashboard with config diff and significance tests, per-query explorer with drill-down, and full BatchRankFlow deep dive.
RankFlow plot for retriever visual evaluation -- a blog post describing practical usage of RankFlow for tuning RAG retrieval pipelines.
If RankFlow helps your retrieval work, consider giving it a ⭐ on GitHub.