
Kubernetes Native Health Check Platform





Canary Checker is a Kubernetes-native platform for monitoring health across applications and infrastructure using both passive and active (synthetic) mechanisms.
- Batteries Included - 30+ built-in active and passive check types
- Kubernetes Native - Health checks, or canaries, are CRDs that reflect health via the
statusfield, making them compatible with GitOps, Flux Health Checks, Argo, Helm, etc. - Secret Management - Leverage Kubernetes Secrets and ConfigMaps for authentication and connection details
- Prometheus - Prometheus-compatible metrics are exposed at
/metrics. A Grafana dashboard is also available. - Self-Contained Storage - Uses embedded Postgres by default and can be configured to use external Postgres.
- JUnit Export (CI/CD) - Export health check results to JUnit format for integration into CI/CD pipelines
- JUnit Import (k6/Newman/Puppeteer/etc.) - Use any container that creates JUnit test results
- Scriptable - Go templates, JavaScript and CEL can be used to:
- Evaluate whether a check is passing and severity to use when failing
- Extract a user friendly error message
- Transform and filter check responses into individual check results
- Extract custom metrics
- Multi-Modal - While designed as a Kubernetes operator, Canary Checker can also run as a CLI and as a standalone server.
- Install Canary Checker with Helm
helm repo add flanksource https://flanksource.github.io/charts
helm repo update

helm install \
  canary-checker \
  flanksource/canary-checker \
  -n canary-checker \
  --create-namespace \
--wait- Create a new check
apiVersion: canaries.flanksource.com/v1
kind: Canary
metadata:
  name: http-check
spec:
  schedule: "@every 30s"
  http:
    - name: basic-check
      url: https://httpbin.flanksource.com/status/200
    - name: failing-check
      url: https://httpbin.flanksource.com/status/500
2a. Run the check locally (Optional)
wget  https://github.com/flanksource/canary-checker/releases/latest/download/canary-checker_linux_amd64 \
-O canary-checker &&  chmod +x canary-checker
./canary-checker run canary.yaml
- Apply the check
kubectl apply -f canary.yaml- Check the health status
kubectl get canaryNAME SCHEDULE STATUS LAST CHECK UPTIME 1H LATENCY 1H LAST TRANSITIONED
http-check @every 30s Passed 13s 18/18 (100.0%) 480ms 13s
See fixtures for more examples and docs for more comprehensive documentation.
Run simple HTTP/DNS/ICMP probes or more advanced full test suites using JMeter, k6, Playwright, Postman/Newman, or any container that can emit JUnit XML.
# Run a container that executes a playwright test, and then collect the
# JUnit formatted test results from the /tmp folder
apiVersion: canaries.flanksource.com/v1
kind: Canary
metadata:
  name: playwright-junit
spec:
  schedule: "@every 2m"
  junit:
    - testResults: "/tmp/"
      name: playwright-junit
      spec:
        containers:
          - name: playwright
image: ghcr.io/flanksource/canary-playwright:latestVerify that infrastructure is fully operational by checking Kubernetes resources, deploying temporary resources, and running nested checks against them.
# Deploy a temporary pod and service, wait for readiness, call the service, and then clean up.
apiVersion: canaries.flanksource.com/v1
kind: Canary
metadata:
  name: kubernetes-resource-check
spec:
  schedule: "@every 5m"
  kubernetesResource:
    - name: service-accessibility
      namespace: default
      waitFor:
        expr: 'dyn(resources).all(r, k8s.isReady(r))'
        interval: 2s
        timeout: 2m
      resources:
        - apiVersion: v1
          kind: Pod
          metadata:
            name: httpbin-pod
            namespace: default
            labels:
              app: httpbin
          spec:
            containers:
              - name: httpbin
                image: kennethreitz/httpbin:latest
                ports:
                  - containerPort: 80
        - apiVersion: v1
          kind: Service
          metadata:
            name: httpbin
            namespace: default
          spec:
            selector:
              app: httpbin
            ports:
              - port: 80
                targetPort: 80
      checks:
        - http:
            - name: call-httpbin-service
              url: http://httpbin.default.svc/status/200
      checkRetries:
        delay: 2s
        interval: 3s
timeout: 2mCheck that batch file processes are functioning correctly by checking the age and size of files in local file systems, SFTP, SMB, S3 and GCS.
# Checks that a recent DB backup has been uploaded
apiVersion: canaries.flanksource.com/v1
kind: Canary
metadata:
  name: folder-check
spec:
  schedule: "0 22 * * *"
  folder:
    - path: s3://database-backups/prod
      name: prod-backup
      maxAge: 1d
minSize: 10gbAggregate alerts and recommendations from Prometheus, AWS CloudWatch, Dynatrace, etc.
apiVersion: canaries.flanksource.com/v1
kind: Canary
metadata:
  name: alertmanager-check
spec:
  schedule: "*/5 * * * *"
  alertmanager:
    - url: alertmanager.monitoring.svc
      alerts:
        - .*
      ignore:
        - KubeScheduler.*
        - Watchdog
      transform:
        # for each alert, transform it into a new check
        javascript: |
          var out = _.map(results, function(r) {
            return {
              name: r.name,
              labels: r.labels,
              icon: 'alert',
              message: r.message,
              description: r.message,
            }
          })
JSON.stringify(out);Export custom metrics from the result of any check, making it possible to replace various other Prometheus exporters that collect metrics via HTTP, SQL, etc.
apiVersion: canaries.flanksource.com/v1
kind: Canary
metadata:
  name: exchange-rates
spec:
  schedule: "@every 1h"
  http:
    - name: exchange-rates
      url: https://api.frankfurter.app/latest?from=USD&to=GBP,EUR,ILS
      metrics:
        - name: exchange_rate
          type: gauge
          value: result.json.rates.GBP
          labels:
            - name: "from"
              value: "USD"
            - name: to
value: GBPCanary Checker is ideal for building platforms. Developers can include health checks for their applications in whatever tooling they prefer, with secret management that uses native Kubernetes constructs.
apiVersion: v1
kind: Secret
metadata:
  name: basic-auth
stringData:
  user: john
  pass: doe
---
apiVersion: canaries.flanksource.com/v1
kind: Canary
metadata:
  name: http-basic-auth-secret
spec:
  http:
    - name: http-basic-auth
      url: https://httpbin.flanksource.com/basic-auth/john/doe
      username:
        valueFrom:
          secretKeyRef:
            name: basic-auth
            key: user
      password:
        valueFrom:
          secretKeyRef:
            name: basic-auth
key: passCanary Checker comes with a built-in dashboard by default.
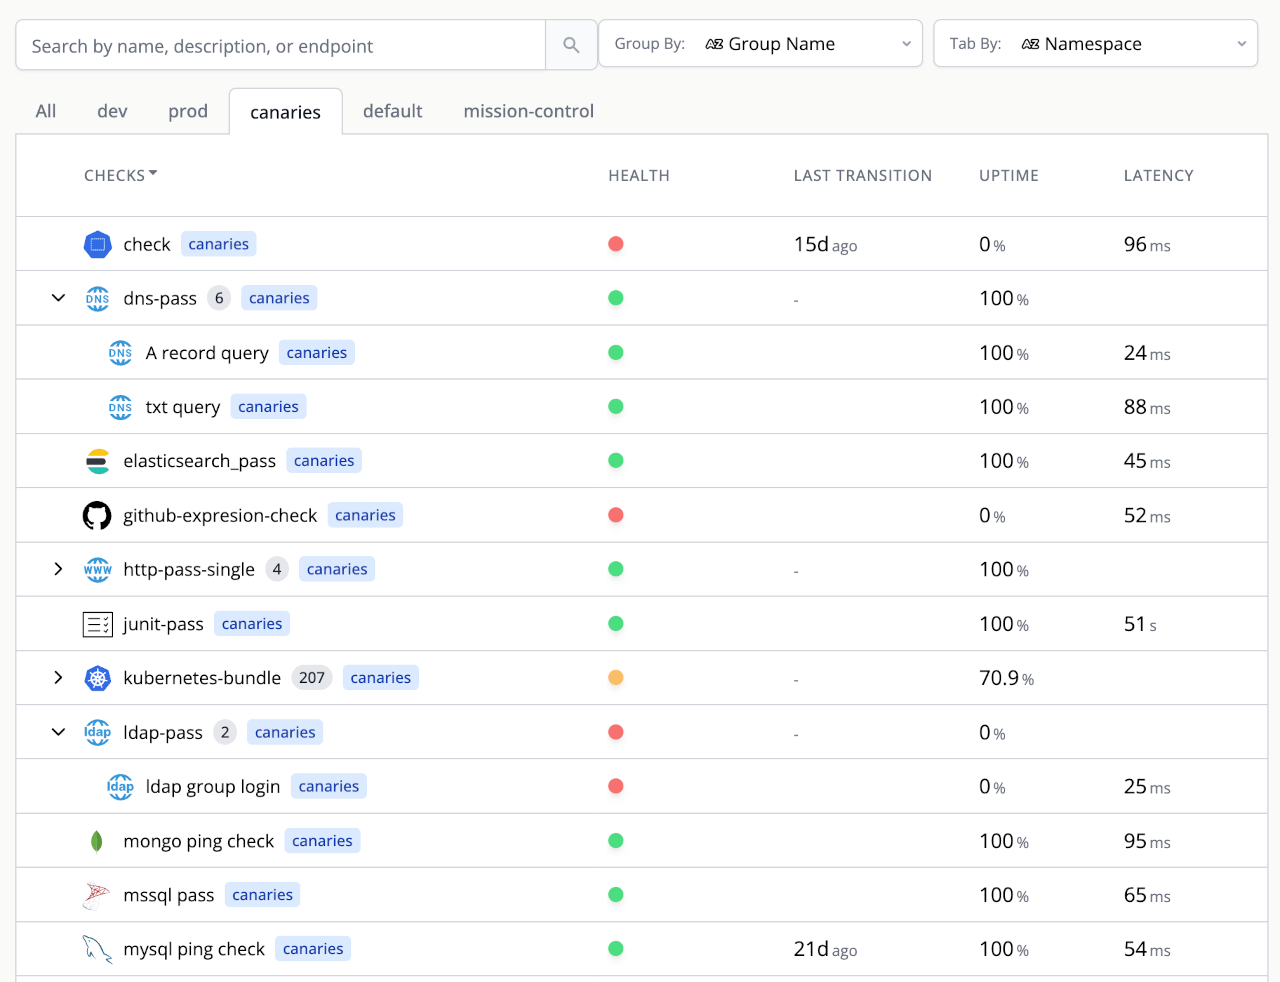
There is also a Grafana dashboard, or build your own using the metrics exposed.
If you have any questions about Canary Checker:
- Read the docs
- Invite yourself to the CNCF community slack and join the #canary-checker channel.
- Check out the YouTube playlist.
- File an issue - (We do provide user support via GitHub Issues, so don't worry if your issue is a bug or not)
Your feedback is always welcome!
| Protocol | Status | Checks |
|---|---|---|
| HTTP(s) | GA | Response body, headers and duration |
| DNS | GA | Response and duration |
| Ping/ICMP | GA | Duration and packet loss |
| TCP | GA | Port is open and connectable |
| Data Sources | ||
| SQL (MySQL, Postgres, SQL Server) | GA | Ability to login, results, duration, health exposed via stored procedures |
| LDAP | GA | Ability to login, response time |
| Elasticsearch / OpenSearch | GA | Ability to login, response time, size of search results |
| MongoDB | Beta | Ability to login, results, duration |
| Redis | GA | Ability to login, results, duration |
| Prometheus | GA | Ability to login, query results and duration |
| Alerts / Events | ||
| Prometheus Alertmanager | GA | Pending and firing alerts |
| AWS CloudWatch Alarms | GA | Pending and firing alarms |
| Dynatrace Problems | Beta | Problems detected |
| PubSub | Beta | Messages received from a Pub/Sub subscription |
| Webhook | GA | Passive checks created or updated by HTTP POST requests |
| DevOps | ||
| Azure DevOps | Beta | Pipeline status and duration |
| Git / GitProtocol | Removed | Use exec, junit or webhook checks instead |
| Integration Testing | ||
| Exec | GA | Run scripts or commands |
| JMeter | Beta | Runs and checks the result of a JMeter test |
| JUnit / BYO | Beta | Run a pod that saves JUnit test results |
| K6 | Beta | Runs k6 tests that export JUnit via a container |
| Newman | Beta | Runs Newman / Postman tests that export JUnit via a container |
| Playwright | Beta | Runs Playwright tests that export JUnit via a container |
| File Systems / Batch | ||
| Local Disk / NFS | GA | Check folders for files that are too few/many, too old/new, too small/large |
| S3 | GA | Check contents of AWS S3 buckets |
| GCS | GA | Check contents of Google Cloud Storage buckets |
| SFTP | GA | Check contents of folders over SFTP |
| SMB / CIFS | GA | Check contents of folders over SMB/CIFS |
| Config | ||
| AWS Config | GA | Query AWS Config using SQL |
| AWS Config Rule | GA | AWS Config rules that are firing, custom AWS Config queries |
| Config DB / Catalog | GA | Custom config queries for Mission Control Config DB |
| Kubernetes | GA | Kubernetes resources that are missing or in a non-ready state |
| Kubernetes Resource | GA | Create temporary resources, run nested checks and clean up |
| Backups | ||
| GCP Databases | GA | Backup freshness |
| Restic | Beta | Backup freshness and integrity |
| Infrastructure | ||
| S3 Protocol | GA | Ability to read/write/list objects on an S3 compatible object store |
| Pod / Namespace | Removed | Use kubernetesResource or kubernetes checks instead |
| Docker / Containerd | Removed | Use kubernetesResource or exec checks instead |
| Helm | Removed | Use kubernetesResource or exec checks instead |
See CONTRIBUTING.md
Thank you to all our contributors!
Canary Checker core (the code in this repository) is licensed under Apache 2.0 and accepts contributions via GitHub pull requests after signing a CLA.
The UI (Dashboard) is free to use with Canary Checker under a license exception of Flanksource UI