This project is a complete end-to-end Cricket Analytics workflow where T20 player's batting & bowling performance data is collected through web scraping, cleaned using Python and transformed the json -> csv file using Pandas, and visualized through an interactive Power BI dashboard.
The goal is to identify player performance trends, strengths/weaknesses, and build a data-driven Dream T20 Playing XI using role-based parameter criteria.
Inspired by: 🎥 Codebasics Cricket Analytics Series
Repository: Cricket Data Analysis
The dataset consists of T20 batting and bowling statistics scraped from ESPN Cricinfo.
Data Includes:
- Player innings-level batting data
- Bowling performance summary
- Player role metadata
- Team-wise and match-wise T20 stats
Data Size: ~2,500+ records
Format: CSV + cleaned DataFrames
| Tool | Purpose |
|---|---|
| Python (Pandas, BeautifulSoup, Requests) | Web scraping, cleaning, preprocessing |
| Jupyter Notebook | EDA & feature engineering |
| PostgreSQL | SQL-based filtering & analysis |
| Power BI | Dashboard creation & data storytelling |
| DAX Measures & Calculated Columns | KPI calculations |
| Parameter Scoping PDFs | Role-based player criteria |
Using BeautifulSoup and Requests, raw player data was extracted from ESPN Cricinfo.
Scraped Features:
- Batting average, strike rate, boundary %
- Bowling economy, strike rate, dot ball %
- Player roles & innings breakdown
Challenges solved:
- HTML inconsistencies
- Pagination scraping
- Merging batting + bowling data
(Notebook reference:
t20_data_preprocessing.ipynb)
Performed using Pandas in Jupyter Notebook.
Tasks Completed:
- Removed duplicates & missing values
- Standardized columns
- Calculated new metrics:
- Boundary %
- Balls faced per innings
- Dot ball %
- Bowling strike rate
- Merged player role information
Generated output files:
batting_summary_cleaned.csvbowling_summary_cleaned.csv
Role-based filtering performed using criteria from your Parameter Scoping PDFs.
- Avg > 30
- SR > 140
- Boundary % > 50%
- Position < 4
- Avg > 40
- SR > 125
- Balls faced > 20
- Position > 2
- SR > 130
- Balls faced > 12
- Position > 4
- Bat SR > 140
- Economy < 7
- Bowling strike rate < 20
- Dot % > 40
- Economy < 7
- Bowling strike rate < 16
These filters were applied using Pandas (for data filtering, feature engineering, and transformation) and Power BI DAX (for KPIs inside the dashboard).
After preprocessing the batting and bowling datasets, all player selection logic was implemented using Pandas inside the Jupyter Notebook.
- Filtered Openers using Avg > 30, SR > 140, Boundary% > 50 and Position < 4
- Identified Anchors using Avg > 40, SR > 125, Balls Faced > 20
- Selected Finishers based on SR > 130 and lower-order batting position
- Extracted All-rounders using combined batting & bowling metrics
- Ranked Fast Bowlers using Economy < 7, Dot% > 40, Strike Rate < 16
- Calculated Boundary%, Dot Ball%, Balls Faced per Innings, Bowling Strike Rate, Runs per Over, etc.
- Merged batting & bowling datasets for all-rounder evaluation
- Applied filtering conditions to create final role-wise player lists
Inside Power BI:
- Created KPI cards using DAX (Avg Runs, Strike Rate, Economy, Dot %, Wickets)
- Built ranking measures for comparing players within roles
- Designed slicer-based dynamic comparisons
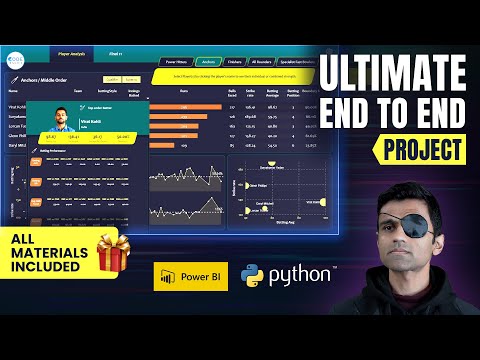
The dashboard includes:
- 🏏 Player role filters
- 📈 KPI cards (Runs, Avg, SR, Economy, Dot %, Wickets)
- 🔥 Best Playing XI (Data-driven)
- 📌 Player role comparison
- ⚡ Fully interactive slicers (team, position, role)
- 🎨 Professional theme based on dashboarding principles
Dashboard File:
📁 Cricket_data_analysis.pbix
Reference Files:
DAX-Measures-and-Calculated-Columns.xlsxDashboarding-Tips.pdfParameter-Scoping.pdf
- Identified openers with 150+ Strike Rate and high boundary %.
- Found fast bowlers with Economy < 7 and Dot ball % > 40%.
- Anchors with Average > 40 and high balls-per-innings stability.
- Built a Data-driven Best T20 Playing XI.
- Highlighted role-specific strengths & weaknesses.
Make sure you have the required Python libraries:
This script collects raw player data from ESPN Cricinfo.
Open the Jupyter Notebook:
t20_data_preprocessing.ipynb
Inside this notebook, the following steps are performed:
- Load scraped JSON data
- Clean & preprocess datasets using Pandas
- Create derived metrics such as:
- Boundary%
- Dot Ball%
- Average Balls Faced
- Bowling Strike Rate
- Bowling Economy
- Merge batting & bowling data where required
- Export final cleaned CSV files for dashboard use
After preprocessing, the notebook generates the following cleaned files:
batting_summary_cleaned.csv
bowling_summary_cleaned.csv
These are the input data sources for the dashboard.
Open the dashboard file:
Cricket_data_analysis.pbix
Inside Power BI, you can:
- Explore player filters (teams, roles, positions)
- View KPI cards (SR, Avg, Economy, Dot%, Wickets)
- Analyze role-based player rankings
- Examine department-wise performance
- Check the final Data-Driven T20 Best Playing XI
📚 Reference
Project inspired by:
👨💻 Author
Utkarsh Singh
GitHub: https://github.com/Utkarshv05
Email: utkarshsingh2504@gmail.com
LinkedIn: https://www.linkedin.com/in/utkarsh-singh-us02052004/